Tell me your data so that I can understand your message. Any presentation, whether that is a scientific conference, a government briefing or a business plan relies on the data to support the single identifiable and memorable message. A graphical representation of this in supportive media should be explicit about what the data shows. Do not force the audience to interpret complex information on a slide rather tell me your data point.
Aristotle emphasises the tricolon of a presentation; logos, ethos and pathos. A message must be supported by a logical, structured argument. This is frequently strong in the p1 of a presentation but hugely muddled by the associated p2. The data that supports the message should be immediately clear from a graphical representation. Data tables and graphs that are taken directly from documents fail to achieve this as they are designed for an entirely different medium. They must be improved to tell me your data point.
The recent UK Government presentation was a perfect example of how to do a presentation, really quite badly. The slides in particular highlight the issue that whilst encased in the image there probably are multiple facts that support the message, to understand that data one must be educated in such graphical representation of complex data, able to interpret the data as displayed and free to process this information without auditory contradiction. This is very hard whilst the speaker continues talking.
The litmus test of a good data slide is that the meaning of the data can be gained within three seconds. Scroll down to see one of the slides from that presentation and see how long it takes you to glean the implications of the data presented. If you would really like some evidence, time yourself, properly. (forgive the formatting but I know you will have checked ahead)
.
.
.
.
.
.
.
.
.
.
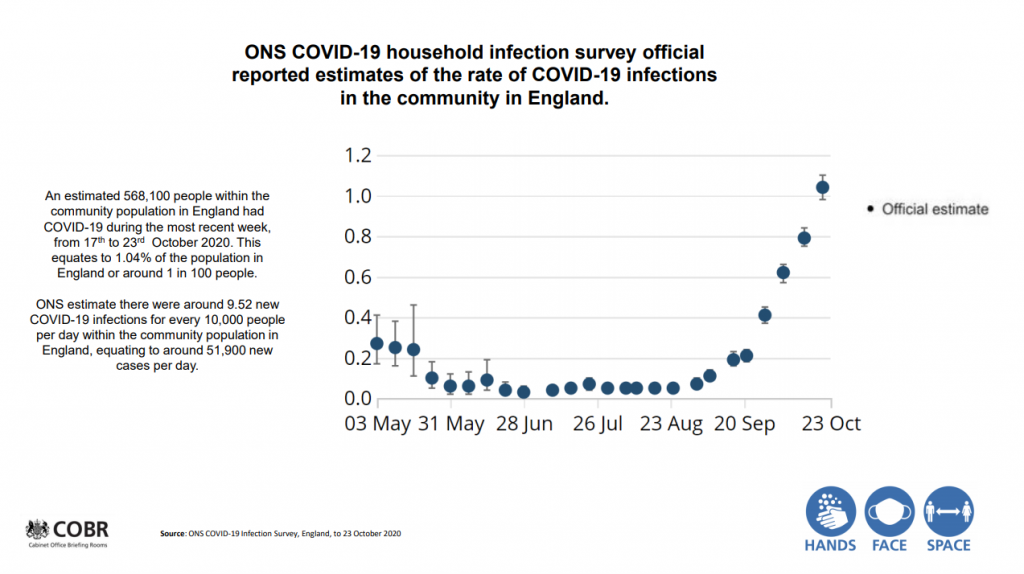
How long was that? More than 3 seconds I am sure. Let’s consider some of the issues. The template steals 40% of the real estate and makes the slide harder to view. The icons are superfluous to the single slide but you did read them. And have just done so again. Despite trying not to, you read the information on the left hand side of the slide next to try to understand the message. (You retained none of those numbers. What are the dates??) Nor did you remember what the three icons were that you looked at first. You have looked again to check. You probably quite rapidly recognised the slope of the graph is showing obvious increase but in order to figure out what was increasing you sought the meaning of the y axis but this wasn’t clear so you had to assume the text on the left explains this. So you re-read that. And still don’t fully understand it. Or remember the details. How many new infections are there? Then with a clear(er) understanding of probably what was displayed you returned again to examine the chart. That was more than 3 seconds and whilst you were attempting this the presenter carried on talking.
Never minimise the fact that all of these data points are important. They are not important however to the single fact being discussed at that point in the presentation. This fact is key to the decision to re-introduce lockdown. This chart was displayed for one purpose only and that was to show that the rate of infection is dramatically rising across the last two months compared to the preceding five months. The actual numbers don’t change that fact. The “around 51,900 new cases per day” is an entirely separate fact. That you didn’t remember either is interesting but does not change the key fact of that point in the presentation was to show the dramatic increase in numbers.
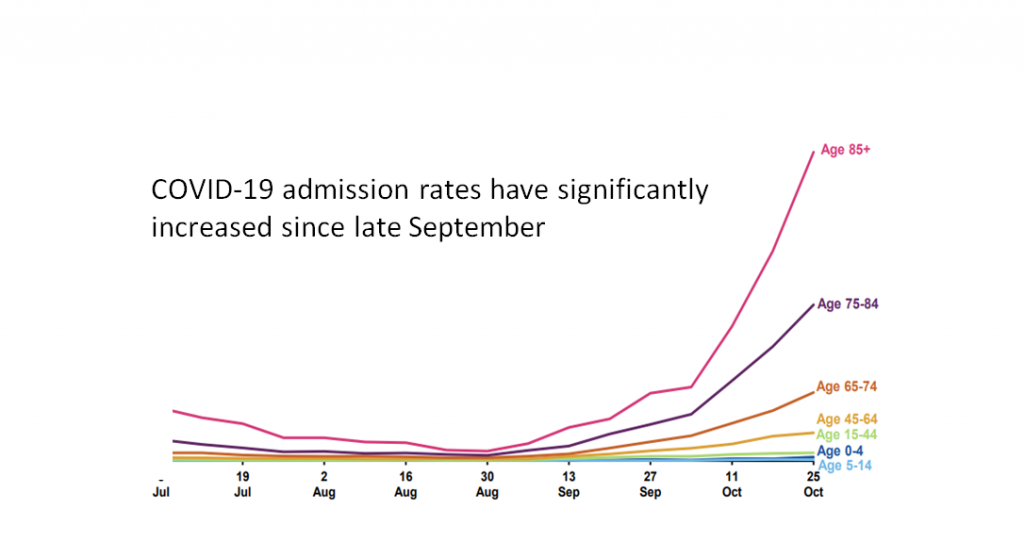
The key for designing an individual slide is to answer the single purpose of the slide, not to transmit all of that data. There is much debate about what data is essential, what data is valuable and what data is superfluous. This is determined by the presenter with a knowledge of the audience needs and of the purpose of the presentation. Further data may be available later in the presentation or even afterwards. Clearly describing the message of the data in text, as it is always interpreted first, allows complex data to be presented graphically in a rapid manner. Compare the after and before slides below also taken from the conference.
.
.
.
.
.
.
.
.
.
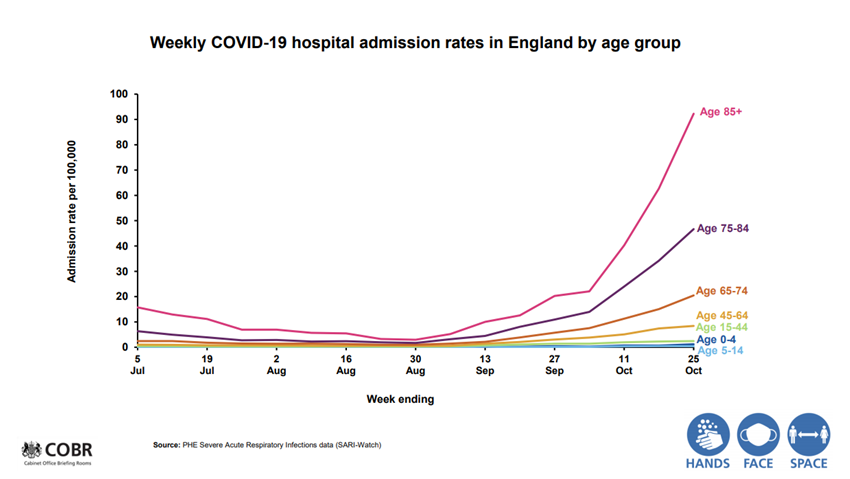
How long did it take for you to interpret the first slide? Consider also how the additional information on the second slide does not add to or change that single message. And you had to turn your head (or device) to one side to figure out the y axis. But you don’t actually remember whether it was admissions per 10,000 or 100,000. The spoken message should be clear and amplified by the graphical message. The full data can be made available if required.
Data is complex. Explaining it in a presentation is a challenge. Tell me your data in your message and use the supportive media to clarify that single message. The message of the first slide you actually read was what? Does this help?
